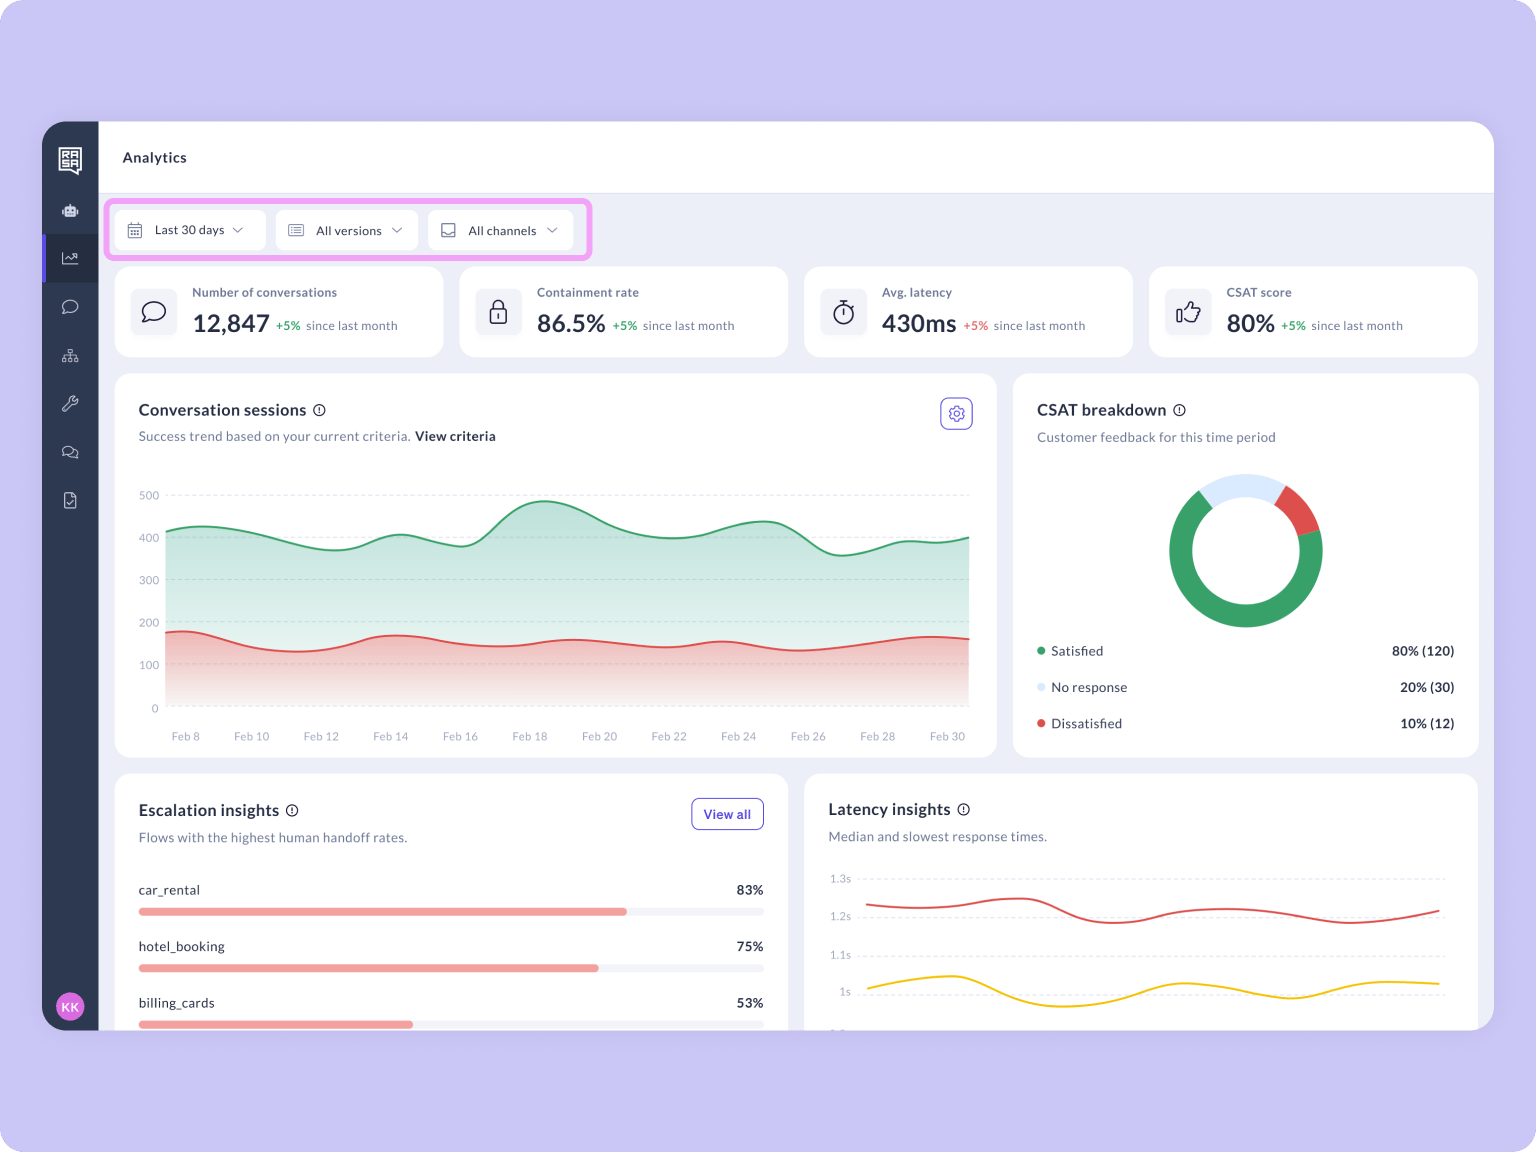
- Are users getting the help they need?
- Is the assistant faster or slower after a release?
- Which flows are working well, and which may need improvement?
Metrics at a glance
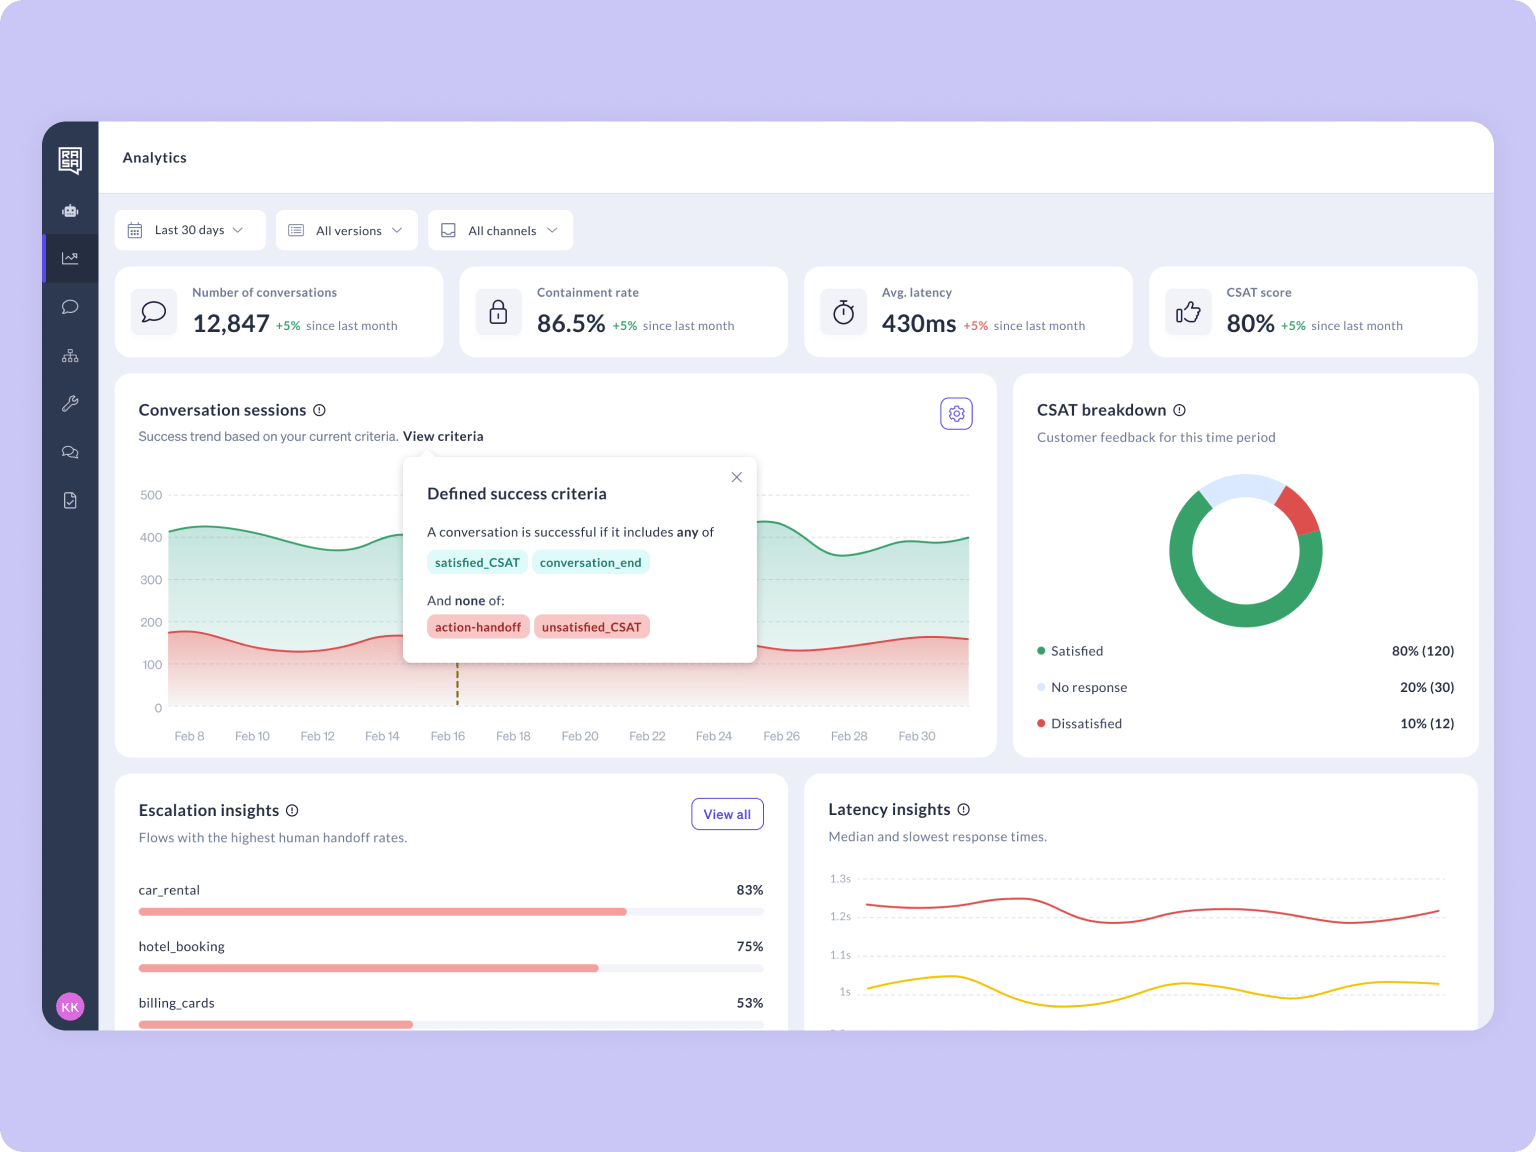
Conversation Volume: The total number of conversation sessions between your assistant and users within the selected time period. Each session is evaluated against your success criteria. These are the conditions you define to determine whether a conversation was successful. For example, you might count a session as successful if the user completes a booking flow without being handed off to a live agent. You can configure these criteria in Settings > Success Criteria so they reflect what success means for your use case.By default, any session that is resolved without reaching a human agent is counted as successful.You can update these criteria at any time as your assistant evolves. Changes only apply to new sessions going forward and do not retroactively affect historical data.
action_handoff_metric configured. This is the action Rasa uses to detect when a conversation is escalated to a human agent. Without it, the system has no way to distinguish contained conversations from escalated ones, and your containment metrics will not be accurate.
Latency: The average time it takes for your assistant to respond to a user message. This is calculated from the moment the user’s message is received to when the assistant’s reply is sent back.
CSAT Customer Satisfaction (CSAT): The percentage of conversations where users provided positive satisfaction feedback. CSAT collection is handled automatically: pattern_customer_satisfaction triggers after pattern_completed once the user indicates they are done, prompting them to rate their experience. Responses are broken down into three categories: Satisfied (user gave a positive rating), Dissatisfied (user gave a negative rating), and No Response (no feedback was provided)
CSAT mappingIf a CSAT scale from 1 to 5 is used, ratings are grouped as follows:
- Satisfied: ratings 3–5
- Dissatisfied: ratings 1–2
Analytics Overview
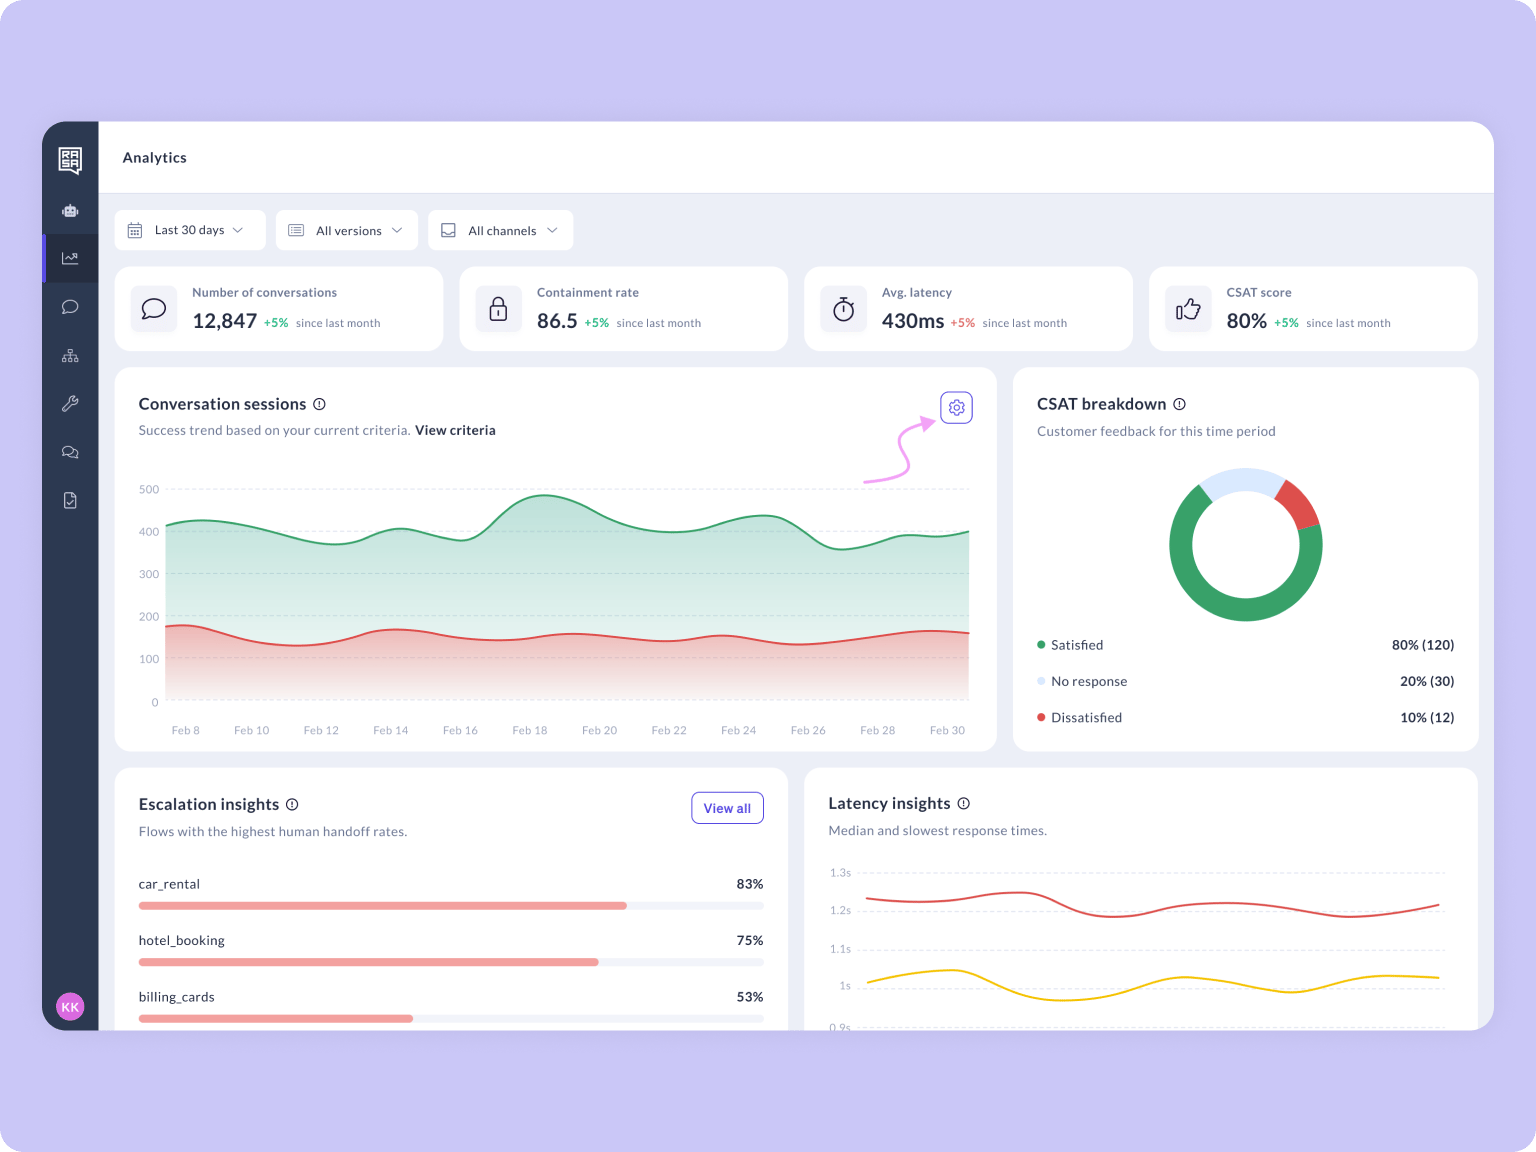
The Analytics dashboard gives you a single view of your assistant’s health across four key metrics: conversation volume, containment, latency, and CSAT. Each metric is visible at a glance at the top of the dashboard, with charts and insights below that help you dig deeper. Use the dashboard to spot trends over time, compare performance across versions, and identify which flows need attention, all without leaving Rasa Studio.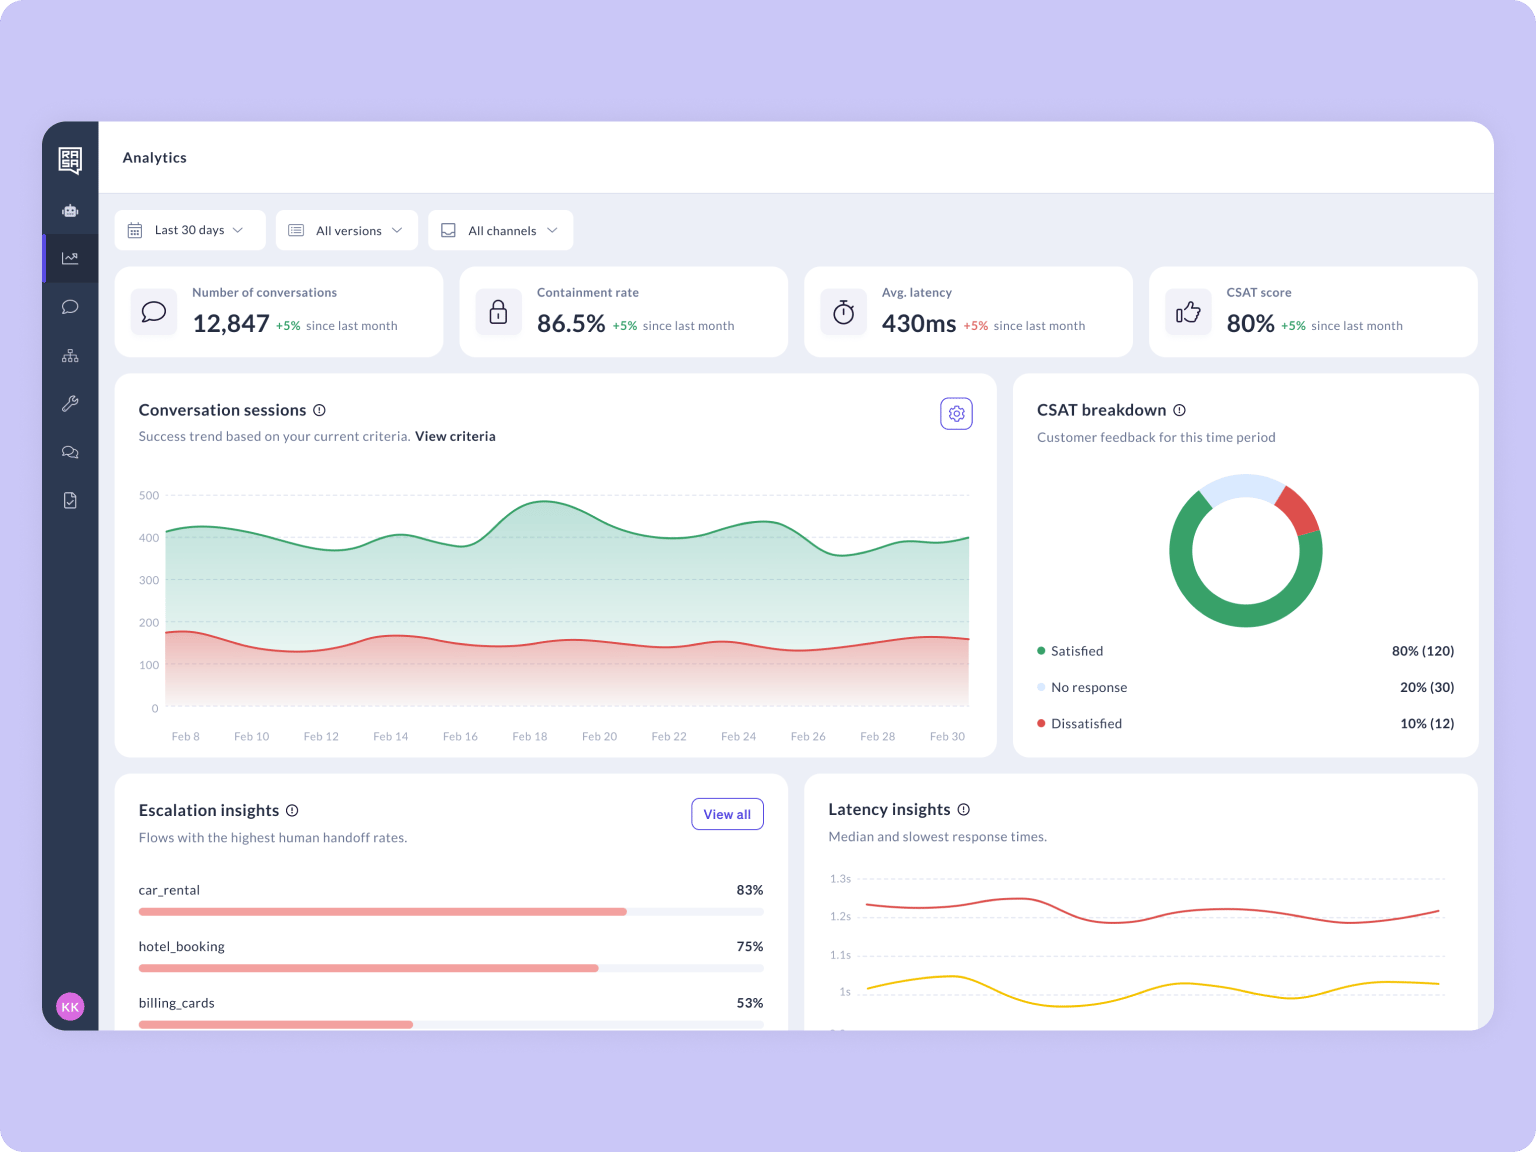
Conversation Volume
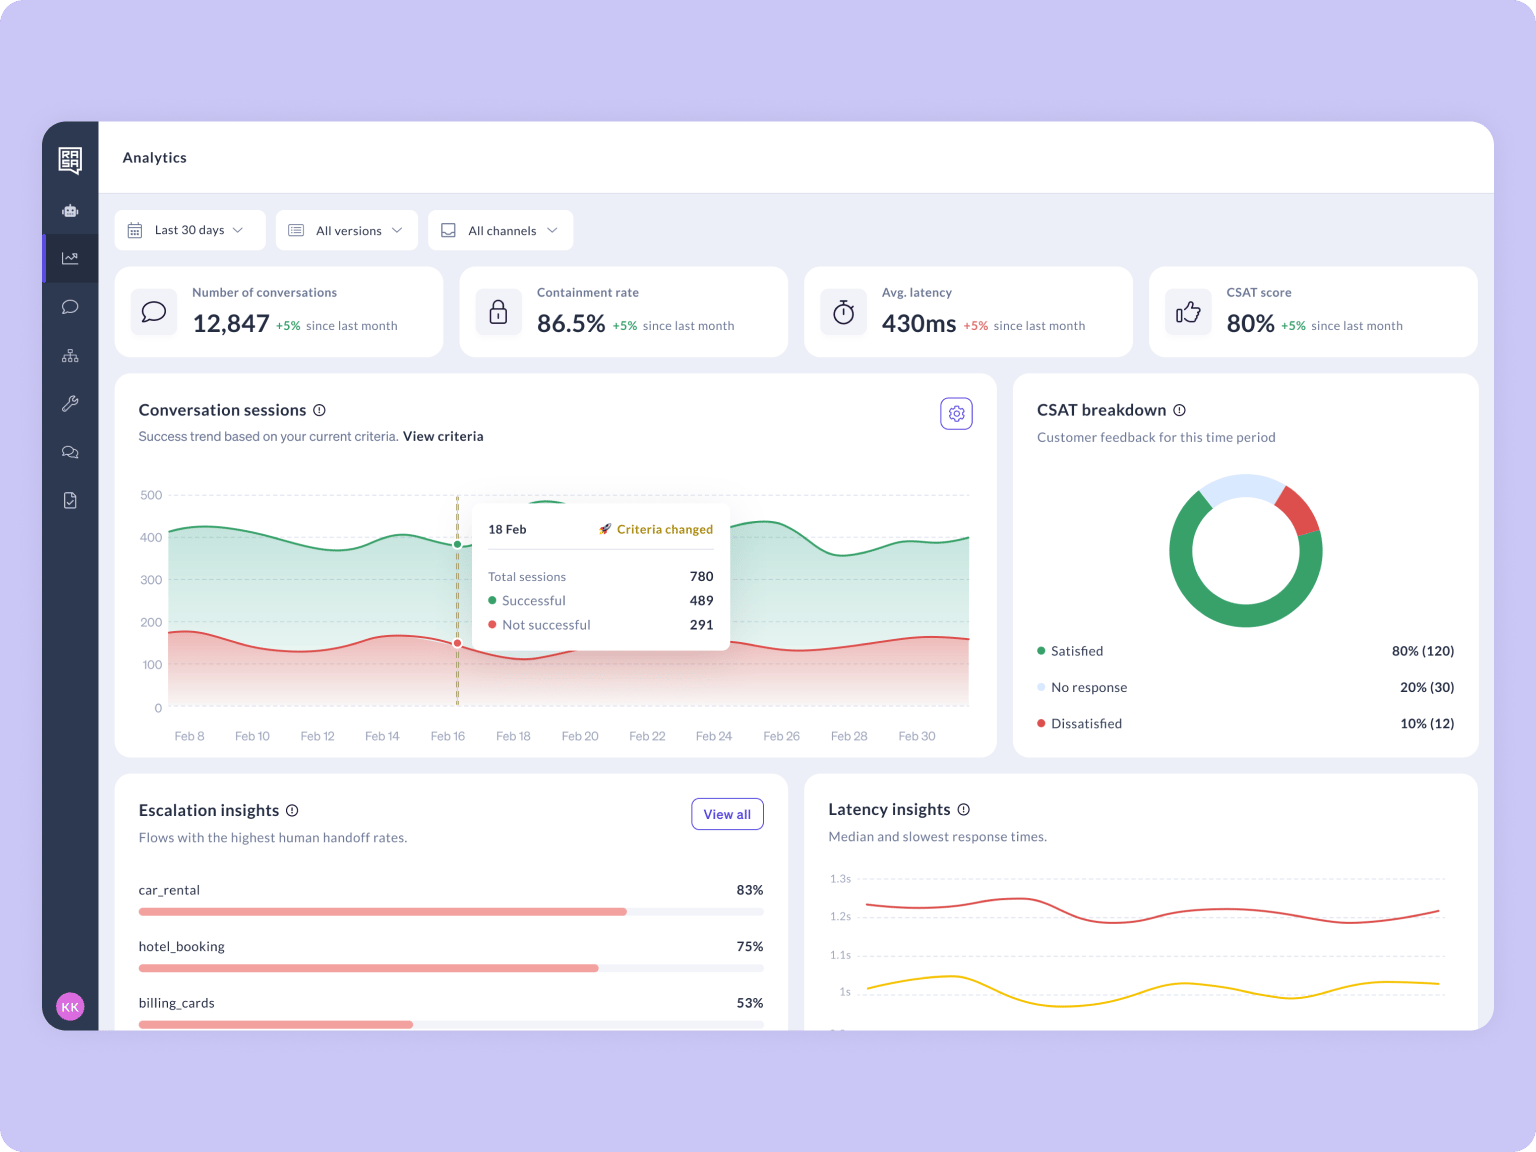
The conversation volume chart displays all conversations within your selected time period, divided into successful and unsuccessful conversations giving you an immediate sense of how well your assistant is handling user requests at scale.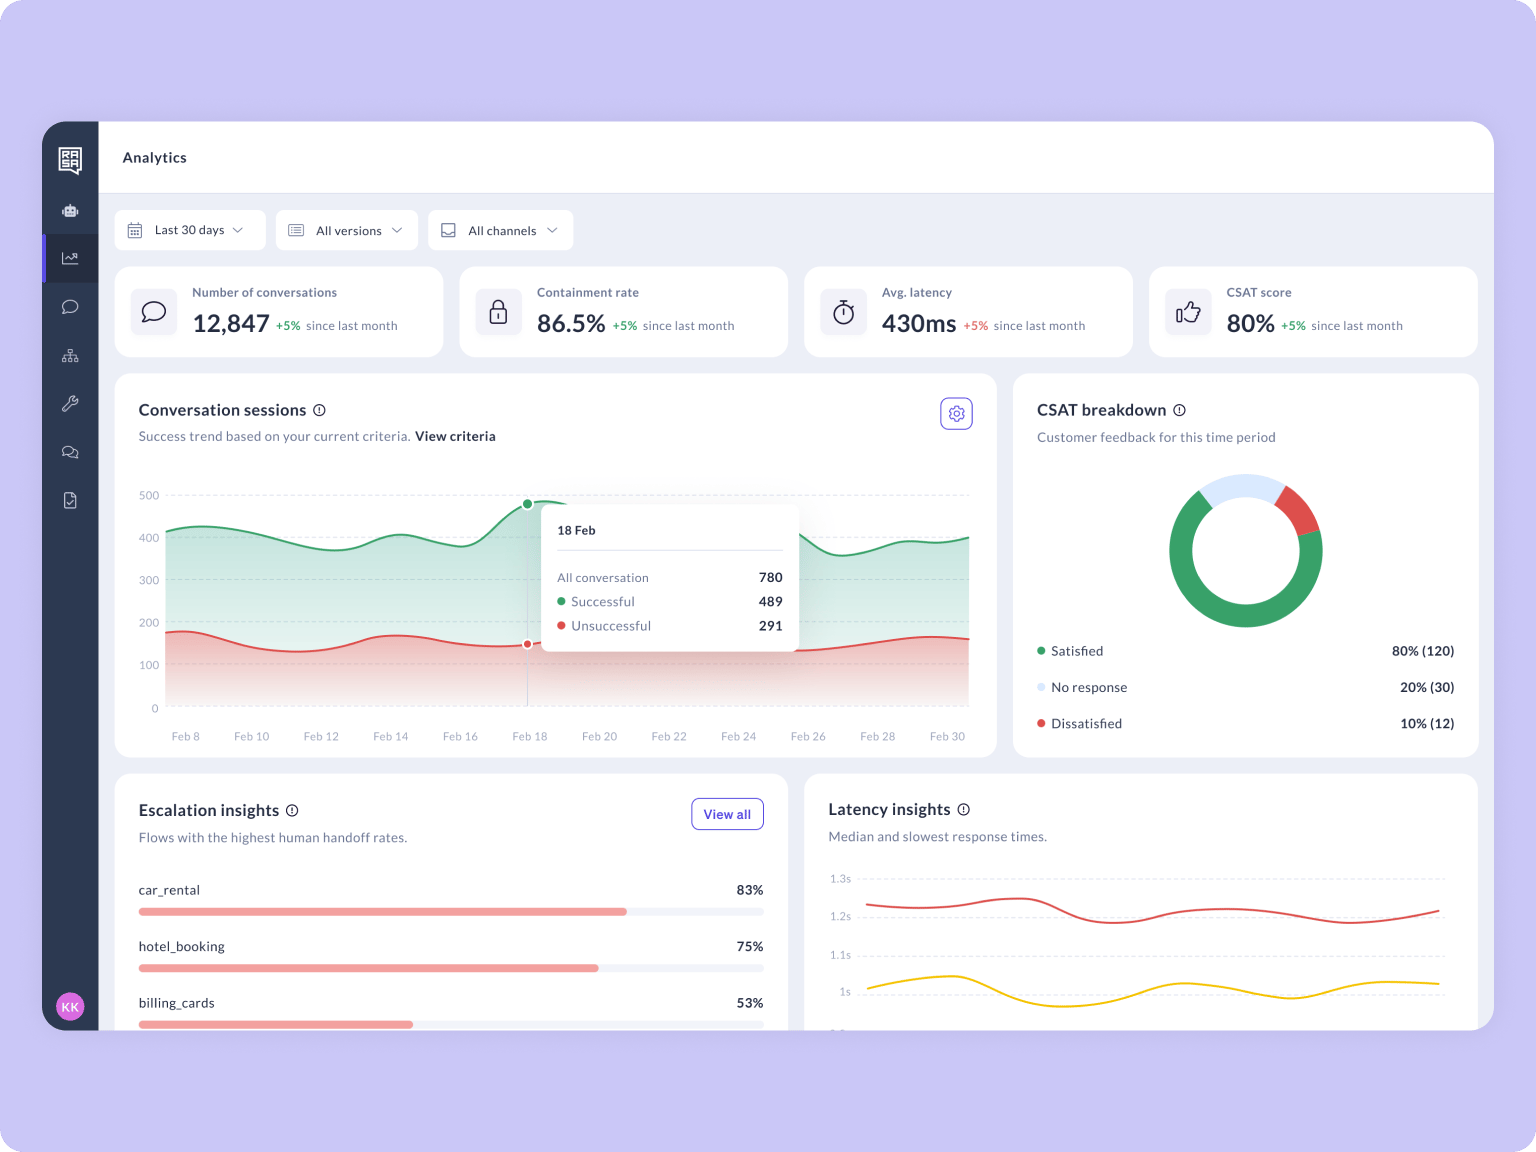
Counts may differ from Conversation ReviewThe volume shown here may not match what you see in Conversation Review for the same date range. Analytics counts sessions and is calculated in a nightly batch job, while Conversation Review counts conversations in real time.
Configuring Success DefinitionWhat counts as a “successful” or “unsuccessful” conversation? That’s up to you. Use the configuration panel to define your own success criteria so the chart reflects what matters most to your team.
Viewing Conversations from the Chart
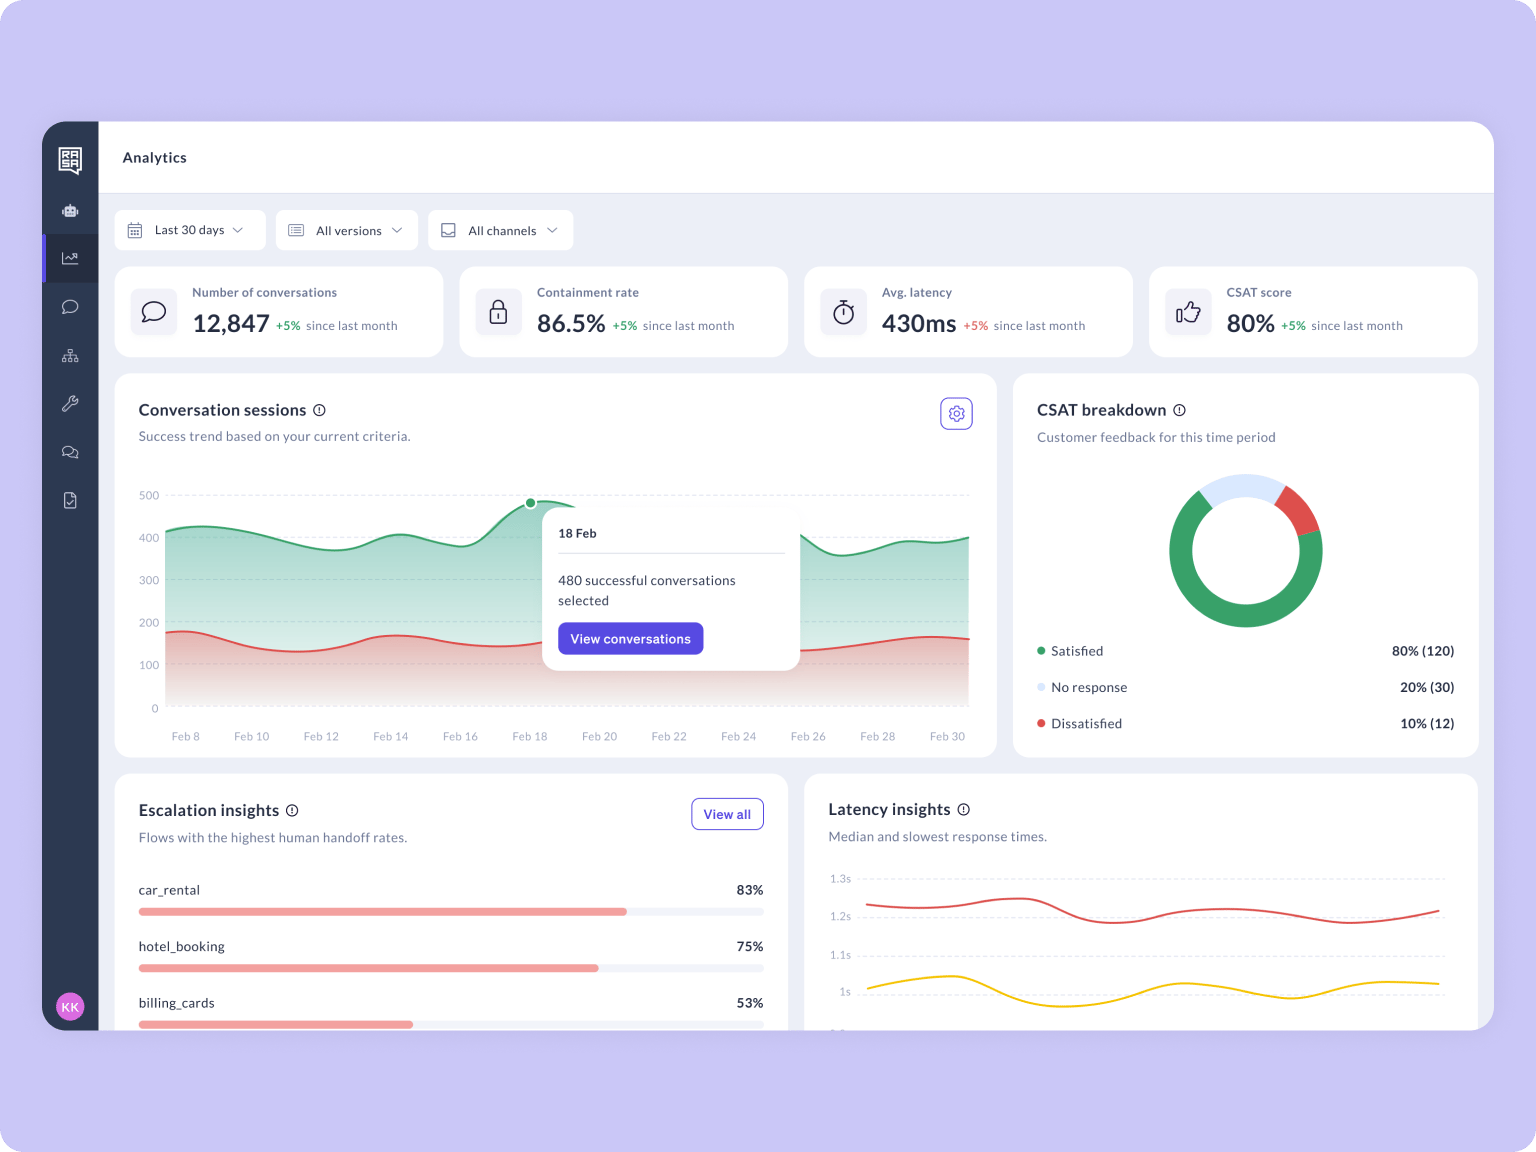
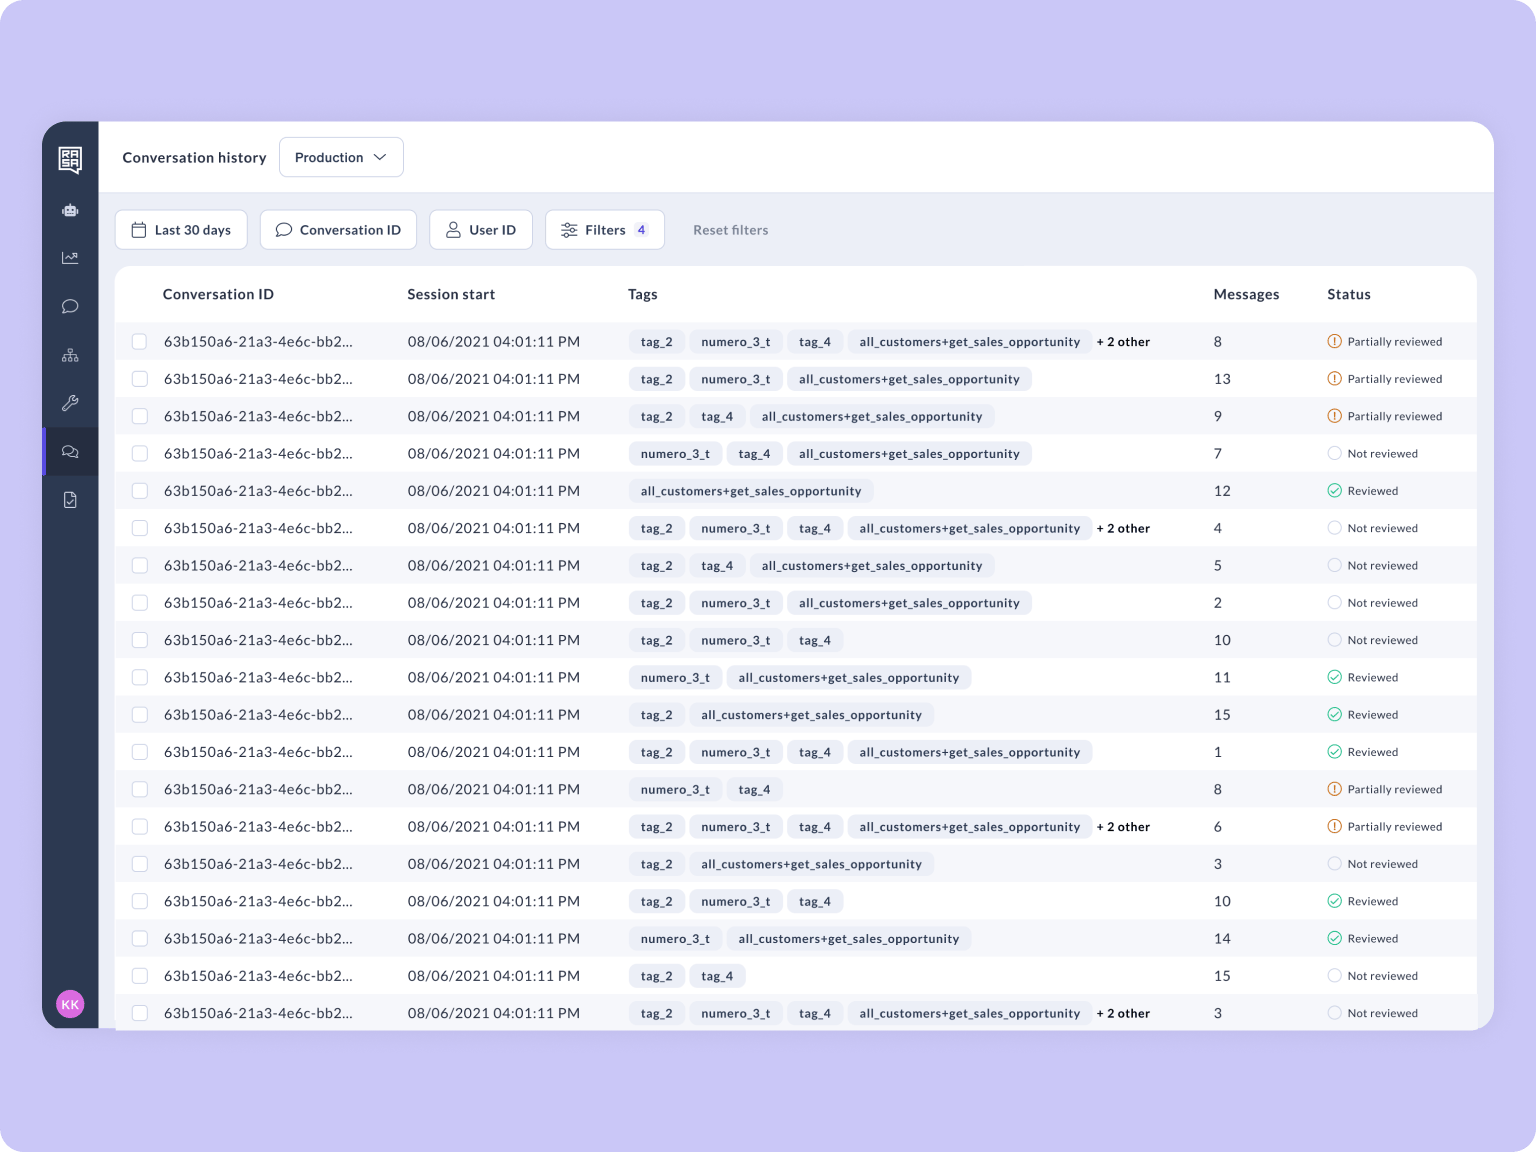
You can go directly from the Conversation Volume chart to the individual conversations behind the data. Click on any bar in the chart to open a filtered view of the conversations that make up that data point. This lets you:- Review successful conversations to understand what’s working well.
- Investigate unsuccessful conversations to identify where users are dropping off or getting stuck.
- Spot patterns across conversations for a specific day or time period without manually setting up filters.
How to Define Success:
The Conversation Volume chart displays all conversations within your selected time period, split into successful and unsuccessful. This gives you an immediate sense of how well your assistant is handling user requests at scale.To configure what counts as a successful conversation: Open the configuration panel: Click the ⚙️ settings icon on the Conversation Volume chart.
Escalation Insights
Escalation Insights surfaces a ranked list of the flows with the highest escalation rates — the ones most often resulting in a handoff to a human agent. Instead of guessing where your assistant struggles, you get a clear priority list of what to fix first. Each row represents a flow in your assistant. High escalation rates signal flows that may need better design or additional knowledge.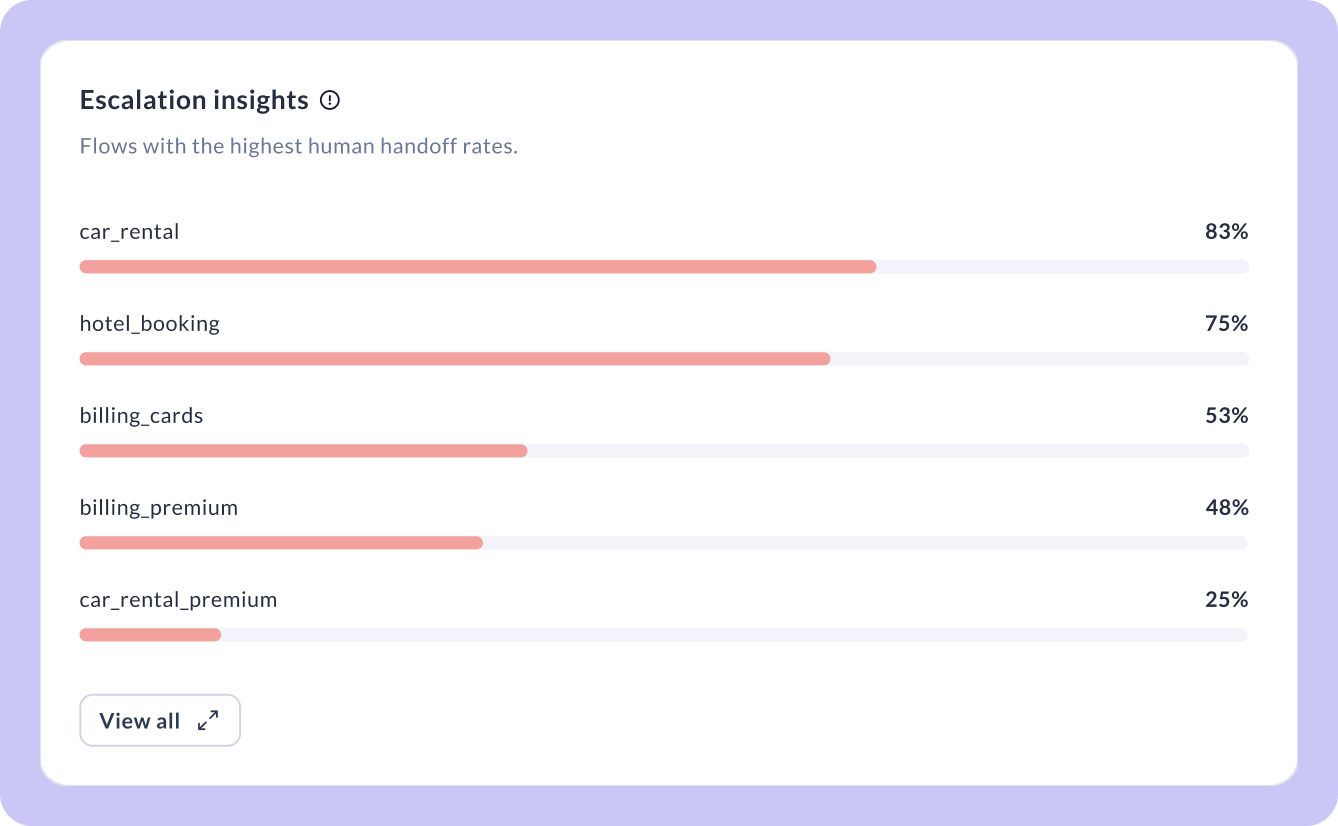
Latency Insights
Latency Insights breaks down your assistant’s response times across the selected period into three percentile trend lines, giving you a nuanced view of performance beyond a single average. Use this view to detect latency degradation before it impacts user experience. Comparing p50, p95, and p99 helps you distinguish between a general slowdown affecting everyone versus tail latency issues impacting a subset of conversations.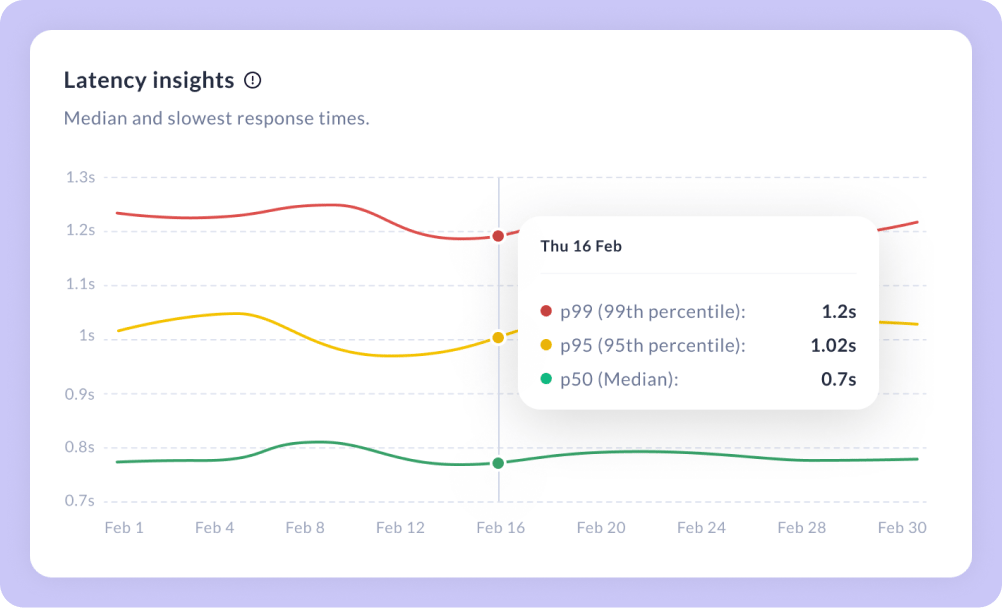
Filters
Applying filters to the Analytics dashboard helps you compare how different assistant versions perform, isolate channel-specific issues, or zoom into a specific week to investigate a spike.