

Why No Out-of-the-Box Dashboards?
Rasa aims to be flexible enough to support an extensive range of use cases. Since every assistant has different requirements, business goals, and domain-specific metrics (e.g. drop-off rates in a financial flow vs. average handle time in a customer support flow), providing universal, out-of-the-box dashboards is rarely sufficient. Instead, Rasa outputs complete raw conversation data to your system of choice so you can build dashboards, analytics, and monitoring pipelines that best match your organization’s needs. Some of the benefits of this approach:- Full control of your data: You can choose a preferred data lake or warehouse solution (e.g. PostgreSQL, Redshift, BigQuery, Snowflake) and how to store, transform, or query events.
- Flexible analytics: You decide how to aggregate, slice, or visualize the data. Integrate with any BI tool, from open-source Metabase to enterprise-grade Tableau or Power BI.
- Customizable KPIs: You can easily blend conversation metrics with business data to track outcomes relevant to your specific domain (e.g. lead conversions, purchase completions, chat escalation reasons, etc.).
Installation Prerequisites
- A Kafka Instance Rasa Pro Services require a production-ready Kafka broker to stream real-time conversation data. Kafka is where all conversation events get published (e.g. user messages, commands from the LLM prompt). We recommend using a managed service such as Amazon MSK to simplify maintenance and scaling.
- Rasa Pro Services You need to deploy Rasa Pro Services alongside (or as part of) your assistant’s infrastructure. Rasa Pro Services handle the ingestion of events from Kafka and can transform them before streaming them to your configured data warehouse. Once set up, you can start computing analytics as soon as Rasa Pro Services connect successfully to Kafka and your data storage.
- (Optional) A Data Warehouse By default, you can configure Rasa to store raw conversation data in PostgreSQL or Redshift. If you prefer other warehousing solutions such as BigQuery or Snowflake, you can sync them via intermediate steps (e.g. streaming from PostgreSQL into Snowflake). This stage is optional in a local/testing setup but strongly recommended for production.
What Can You Track with Analytics?
Once your assistant is streaming events to the Analytics Pipeline, you can capture many types of conversation data. You can categorize these into four broad areas:-
User Analytics
Identify who your assistant’s users are and how they feel about the assistant.
- Examples: user demographics, session frequency per user, feedback/sentiment
-
Usage Analytics
Discover overall traffic and assistant health.
- Examples: total number of sessions, average session duration, error rates, active channels
-
Conversation Analytics
Gain insights into how dialogues unfold.
- Examples: top flows triggered (in CALM-based assistants), top NLU intents (in NLU-based assistants), average number of turns, drop-off at specific flow steps, escalation or human-handoff patterns
-
Business Analytics
Measure how the assistant performs against business-critical objectives.
- Examples: ROI per line of business, containment rate (how many conversations were fully automated vs. handed to a human), interruption rates, success rates on business flows
Example Queries
This section helps you get started with analyzing your assistant’s conversations. The examples use SQL queries together with an example visualization in Metabase.Number of Sessions per Month
A common high-level usage metric of your assistant is the number of sessions per month. Here is how it would look as an SQL query: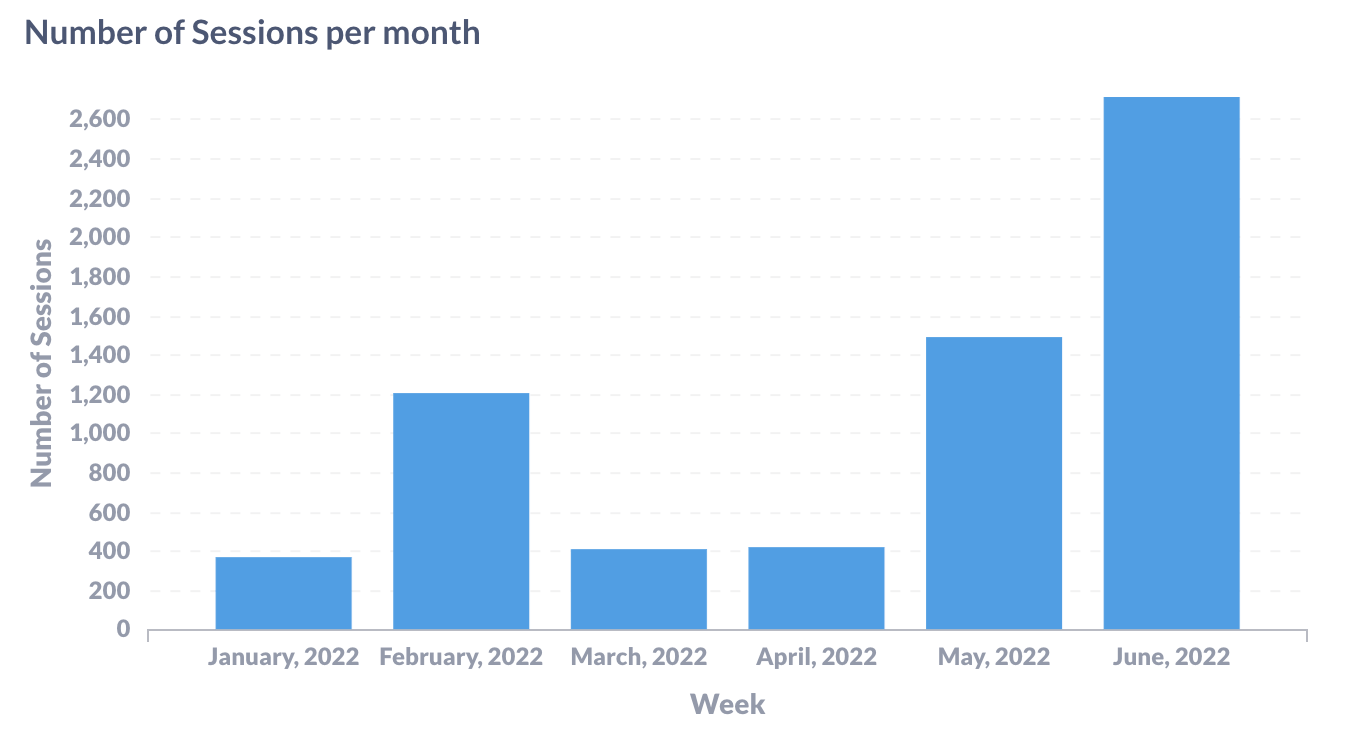
Number of Sessions per Channel
If you’re connecting your assistant to multiple channels, it could be useful to look at the number of sessions per channel, let’s say per week. The query you would need for this metric is: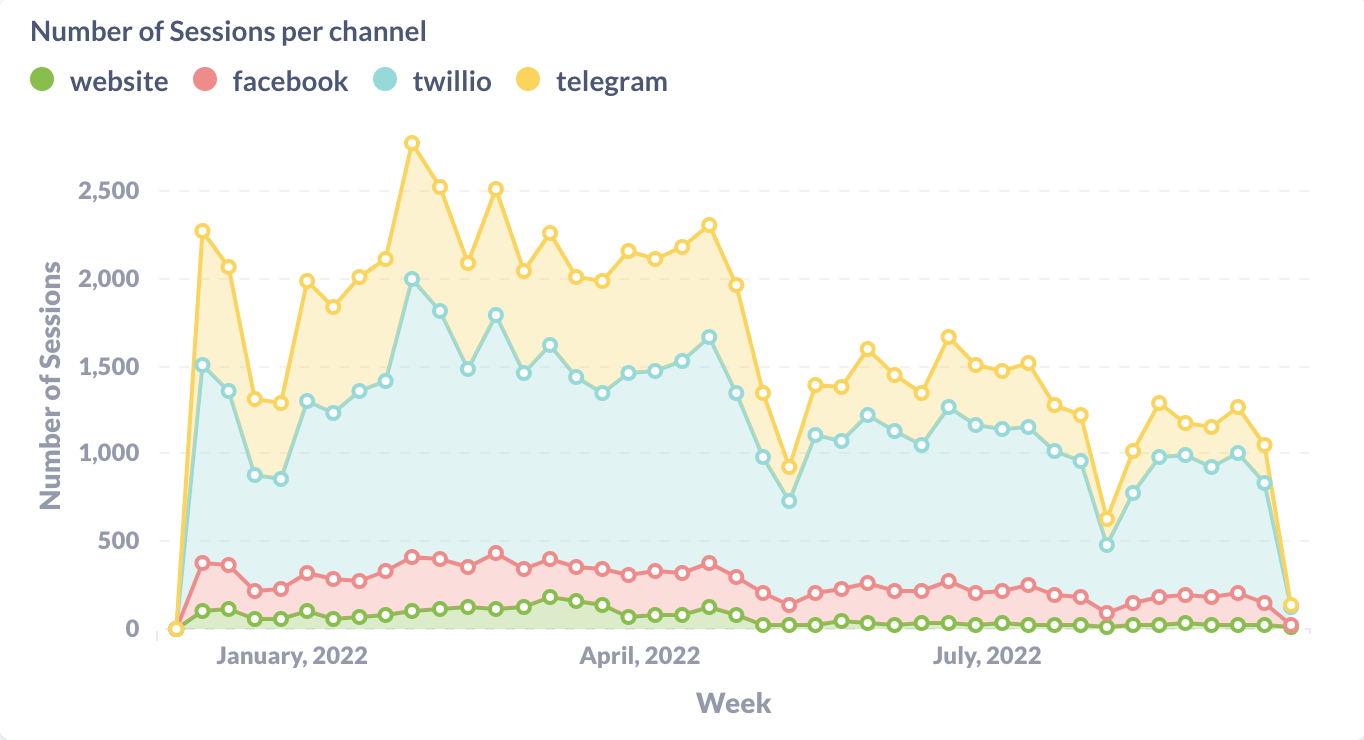
Abandonment Rate
Abandonment rate can be defined in many different custom ways, however here we’ll define it as a session ending without a user message after a specific message was uttered by the bot, e.g.utter_ask_name.
You could adapt the metric to detect sessions ending without a user message
after a specific set of intents. The SQL query would look like this:
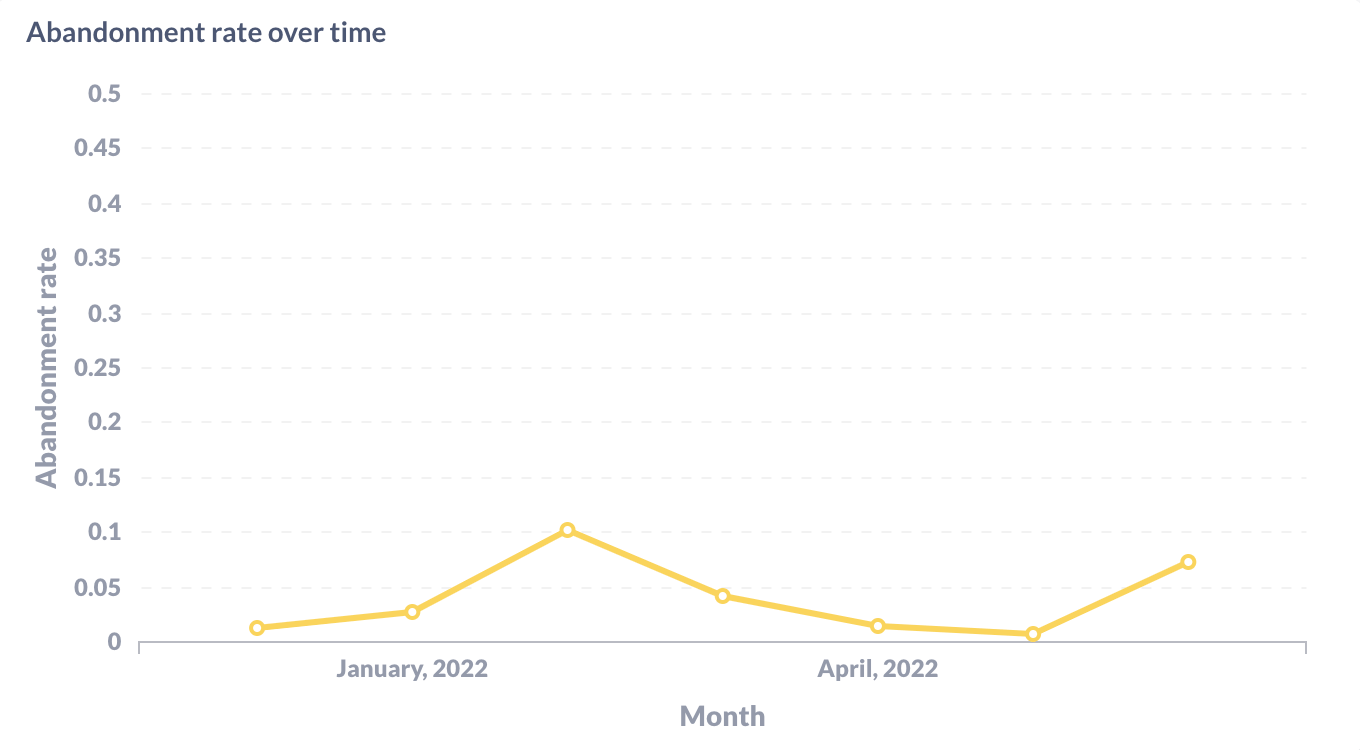
Top N Flows in a Given Time Period
The query below selects the top 5 flows in a given time period (e.g. last 7 days):Escalation Rate
To calculate the escalation rate for CALM-based assistants, you can use this query:Resolution Rate
The resolution rate is a measure of the number of conversations the assistant can resolve without human intervention. This metric can help you gain a better understanding of what happens during a conversation. To understand which conversations are resolved, you can identify which flows are completed in therasa_flow_status table.
You’ll get the resolution rate for a particular flow with this sample query for CALM-based assistants:
Drop-Off Rate for a specific Flow
The drop-off rate is a measure of the number of conversations that do not result in a completed flow. This metric is the inverse of the resolution rate (e.g. 100% - resolution_rate). You can further drill down in finding the interruption rate for a specific flow:Funnel Metrics
Funnel metrics are a great way to understand how users are interacting with your assistant. You can use funnel metrics to understand how many users are completing each step of a flow or how many users are progressing through linked flows.Count of Unique Sessions for Each Step in a Flow
The query below selects the number of unique sessions for each step in a flow:Count of Unique Sessions for each Linked Flow
The query below selects the number of unique sessions for each linked flow in the chain formed of flowreplace_card
linking to flow replace_eligible_card: